
Defining False-Alarm and Miss Rates Without Fooling Yourself
The key to both metrics is not the numerator but the denominator and the counting convention. False-alarm rate is false alarms divided by everything the system flagged; miss rate is misses divided by anomalies that actually occurred. Pick the wrong denominator, report only averages, or ignore idle time, and the numbers look good and mean nothing.
Key takeaways
- The same system can show 1% or 10% depending on the denominator, so agree the convention first.
- A line-wide average hides the worst station; count per station and then aggregate.
- Miss rate is optimistic by construction: an undetected miss never enters the numerator.
- Write acceptance to fix the window, the unit, the sample size and who judges a false alarm.

False-alarm and miss rates usually look better than they are because of the denominator, not the numerator. Write the formulas out before anything else: false-alarm rate is the count of events the system flagged as anomalous that were actually normal, divided by all events the system flagged; miss rate is the number of anomalies missed, divided by the number that actually occurred. Which denominator you pick, whether you count per station or across the line, and whether idle time is included, will all change the number for the same system — so agree the conventions before acceptance, not after.
Write the formulas and name the denominator
| Metric | Formula | Denominator | Common misuse |
|---|---|---|---|
| False-alarm rate | False alarms ÷ all events flagged as anomalous | Every alert raised | Counting only the false alarms an operator confirmed |
| Miss rate | Missed anomalies ÷ anomalies that actually occurred | Anomalies that actually occurred | Counting only what a downstream check caught |
| Accuracy | A combined figure touching both | — | Averaging the two together |
The denominator decides the conclusion. Change the false-alarm denominator to all inspections or all units and the figure looks tiny, because most judgements never raise an alert. Change it to all alerts and it looks alarming. Neither is wrong; they answer different questions, so say which one you are using before comparing. Any report that states a false-alarm rate of 0.5% should say within a line what the denominator was, over what period, and across which stations. When two reports that both claim to pass cannot be compared, it is usually the convention, not the data. Lowering false alarms is an engineering job — the levers are in reducing false alarms. The job here is measuring the result honestly.
Per station, or across the line?
- Line-wide average. Looks good and hides the worst station. On a line of twenty stations, one noisy station can vanish into the average.
- Per station, then aggregate. Locates the problem, at the cost of more data and more reporting — but it is the only convention that drives improvement.
- Split by shift. Lighting, staffing and cycle time differ between shifts; pooling them dilutes each. Read them separately.
- Split by part number. Essential on mixed-model lines, or a systematic false alarm on one part number is buried under normal data from the others. Getting all these views out assumes the system records station, shift and part number — see data traceability.
Ways you end up fooling yourself
- Counting only confirmed false alarms. Alerts an operator dismissed without confirming never enter the numerator, so the rate drops — and those are the alerts that most damage trust. A manual sampling check is a useful cross-reference; see manual inspection versus visual SOP.
- Dropping idle and stoppage time. Counting time when the line was not running inflates the denominator and dilutes the error rate with periods that produced nothing.
- Measuring misses only via downstream catches. A miss that is never discovered never enters the numerator. Miss rate is therefore optimistic by construction and can only be bounded, not measured — say so plainly.
- Reporting the average, never the worst station. Averages hide tail risk, and the tail is where complaints come from. A good line average still hides a station that keeps skipping a step.
- Changing the convention between acceptance and production. One formula at acceptance and another afterwards makes the numbers incomparable, and the argument never ends. Once written into the acceptance document, a convention change should go through the same sign-off.
Writing acceptance criteria you can actually judge
Four steps that close the wording
- Step 1: state the window
For example seven consecutive production days covering at least three shifts, not during the trial. A fixed window makes numbers comparable and filters out a single odd shift.
- Step 2: state the unit
Per station, with the worst-station figure attached. No acceptance on a line-wide average alone; this one line removes most later disputes.
- Step 3: state sample size and who judges
Give a minimum sample count and name who decides whether an alert was false, and against what standard, so that a personal opinion cannot stand in for a decision. Below a certain sample size the metric has no statistical meaning.
- Step 4: state the substitute for miss rate
Agree that it is approximated from downstream checks and sampling, and that it is a lower bound, not full coverage. Writing this in up front is far easier than explaining it later.
Common questions about metric definitions
Can we just watch one of the two metrics?
No. They trade off: loosening the criteria lowers false alarms and raises misses. Optimising one alone almost always means wrecking the other, often without anyone noticing.
Why does it pass acceptance and fail three months later?
Usually drift and convention changes: a new part number, a modified fixture, different lighting, or a quietly changed counting rule. Agreeing a periodic re-test in the acceptance document prevents most of these disputes.
How do we set a baseline with no historical data?
Build it during the pilot, using real data to establish lower bounds for false alarms and misses, then write acceptance targets against that baseline. How to build a baseline is in the visual SOP site assessment checklist.
Acceptance criteria that everyone reads differently?
Send us your acceptance clauses and counting conventions, and we will point out where they can be misread.
Related articles
-
Alarm Fatigue: Why the Floor Turns the System Off
Many visual SOP systems are not beaten by technical problems — they are muted by…
Read more → -
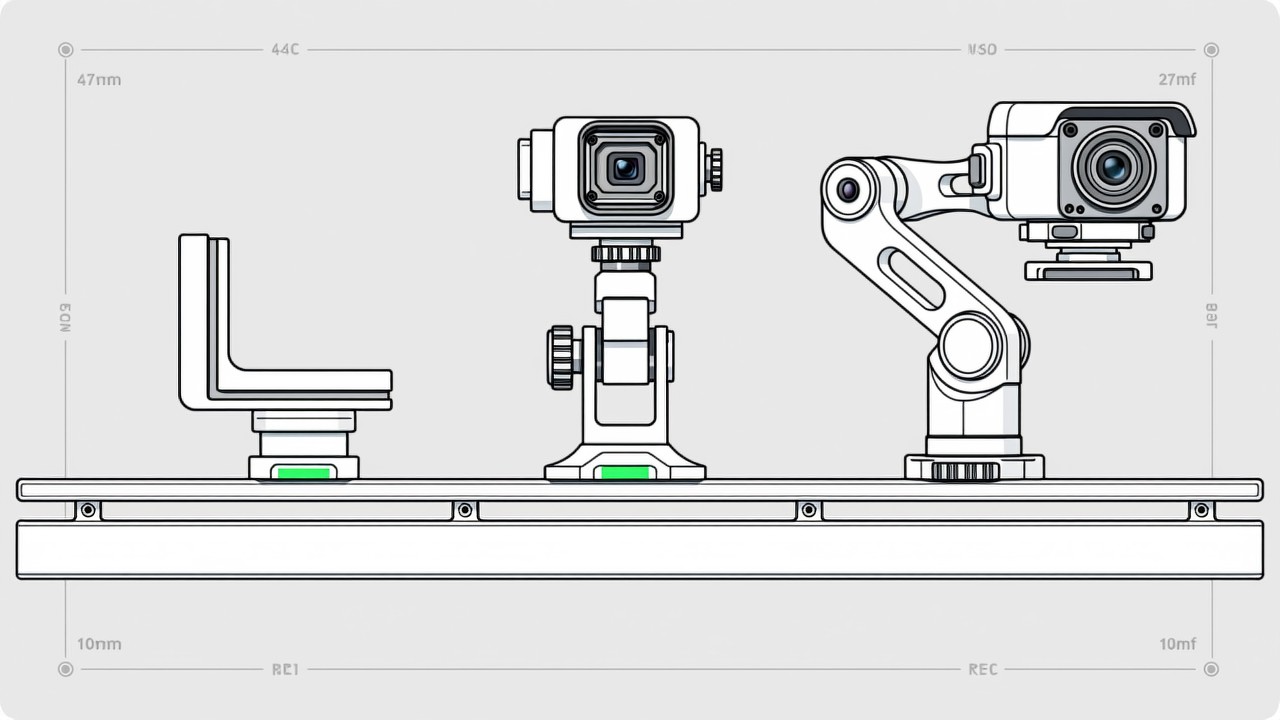
Visual SOP Camera Selection and Mounting
Camera selection for visual SOP is not the same as for product inspection. The s…
Read more → -
Vision Monitoring at the Semiconductor Die Bonder
Semiconductor packaging stations are characterised by high precision, fast cycle…
Read more → -
Wrong-Assembly Alarms Without the False Alarms
The most common reason a visual SOP project fails is not poor recognition — it i…
Read more →
Need specific advice for your production line?
Our engineers can share practical approaches to process error prevention and SOP compliance inspection for your scenario.
Request a free trial plan