
Manual Inspection vs Visual AI SOP: How to Do the Maths
The two cost structures are fundamentally different. Manual inspection is an ongoing expense that grows with shifts and lines; visual SOP is a one-off build with a low marginal cost. Comparing them only makes sense on the same basis — and coverage and useful life matter more than unit price.
Key takeaways
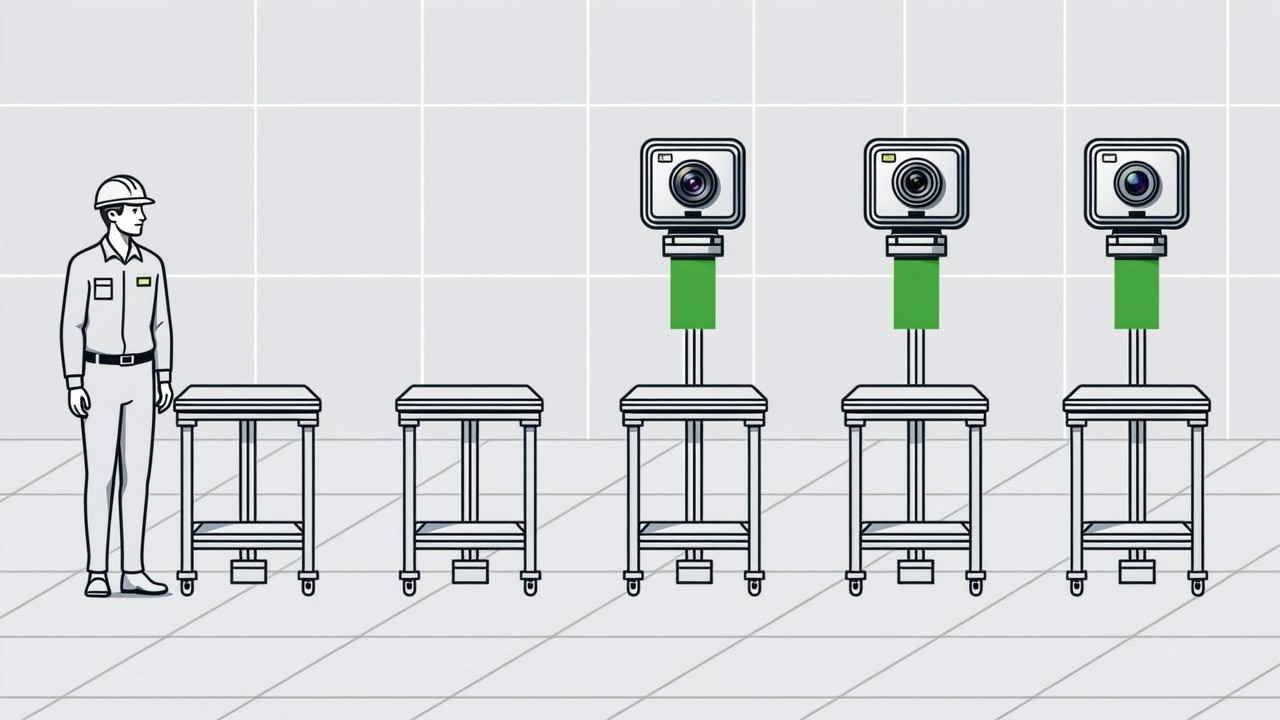
- Manual inspection cost scales linearly with shifts, lines and stations, so it grows the moment you expand.
- Visual SOP is mostly a one-off investment; each extra station costs far less than each extra inspector.
- Comparison only works at equal coverage: inspection is sampled, vision runs at every deployed station all shift.
- The argument that travels furthest internally is built on warranty repair spend.
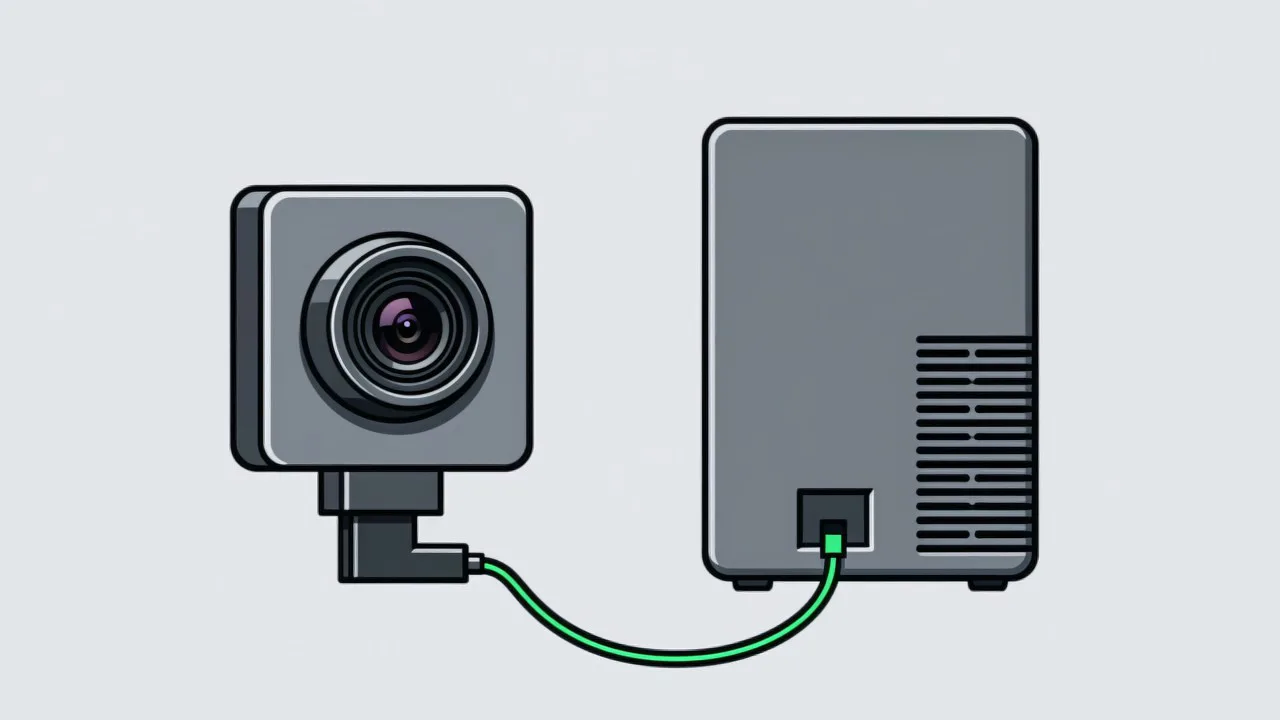
The awkward part of this calculation is that the two cost structures are not alike. Manual inspection is an ongoing expense; a visual SOP deployment is a one-off build. Put both on the same basis before you compare them. If you have not yet pinned down which problem you are solving, start with why SOP execution fails.
What each approach costs
| Cost item | Manual inspection | Visual AI SOP |
|---|---|---|
| Upfront | Low (training, forms) | Moderate (hardware, models, implementation) |
| Ongoing labour | Grows linearly with shifts and lines | Low (configuration and upkeep, not a dedicated role) |
| Coverage | Sampled, inversely proportional to inspection headcount | Continuous, at every deployed station |
| Consistency of judgement | Depends on the individual and drifts over time | Fixed rules, unaffected by shift |
| Traceability data | Handwritten, hard to tie to a unit | Automatically tied to serial number and timestamp |
| Scaling | New lines need new headcount immediately | Scene library is reused, adaptation is short |
How to build a case that holds
Four steps to an annual loss figure
- Step 1: isolate
From warranty and complaint records, pull out the portion whose root cause was a step not being carried out. Keep equipment failures and incoming-material problems out of it.
- Step 2: quantify
Count the annual repair units or batches that belong to that portion. If the data is incomplete, extrapolate from a sampled rate — but state the basis of the estimate.
- Step 3: convert
Multiply by the fully loaded cost of one repair: labour, logistics, parts, and any customer penalty or reputational damage. This is the step that usually produces a number management sits up for.
- Step 4: compare
Set that annual loss against the one-off deployment cost plus annual running cost to arrive at a payback period.
The cost that never makes it onto the spreadsheet
Headcount and hardware are easy to count; drift is not. Two inspectors judging the same unit differently, or one inspector judging it differently in the first hour and the last hour of a night shift, produces a standard that quietly moves. That drift is what turns a customer audit into an uncomfortable conversation, because you cannot show what the acceptance rule was on the day the batch was made. A fixed, written rule produces a stable answer every time, and the same rule can be handed to a customer as evidence rather than defence. The record format that makes this possible is covered under visual SOP data traceability.
There is a second hidden line: mix. A line that runs a handful of similar products can absorb manual inspection reasonably well, because the inspector learns a small number of patterns. When the product mix widens, the number of patterns grows faster than the inspection time available, and coverage falls exactly where it is needed most. That is the situation described in high-mix, low-volume production, and it is where a stored scene library tends to pull ahead of a person who has to recall every variant.
Common questions about the return
What payback period is typical?
There is no universal answer; it depends on the size of the repair loss and the number of stations. Work out the annual loss first, then talk to us about the configuration — we can give you an estimate.
Can we subscribe instead of paying upfront?
The system runs on the customer’s own premises and does not depend on a cloud service, so commercially it is closer to a one-off purchase plus optional support. The commercial form can be discussed at the design stage.
Can visual SOP replace inspectors entirely?
That is not the right way to frame it. The vision system handles real-time monitoring of process execution; inspectors can move to equipment checks, first-article approval and process improvement, which are worth more.
Want to estimate the return on your line?
Give us your station count and repair data and we can produce an estimate.
Related articles
-
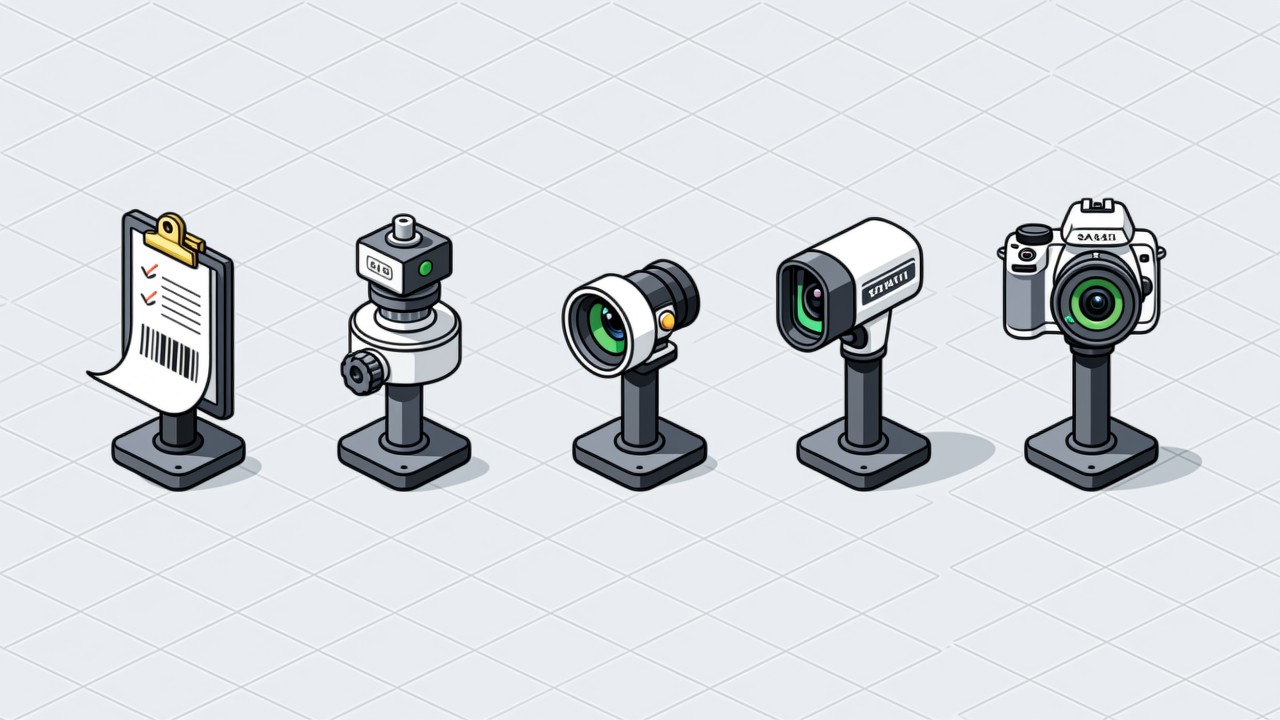
Preventing Missing Operations: Five Methods Compared
There is no silver bullet for a missing operation. Paper sign-off depends on peo…
Read more → -
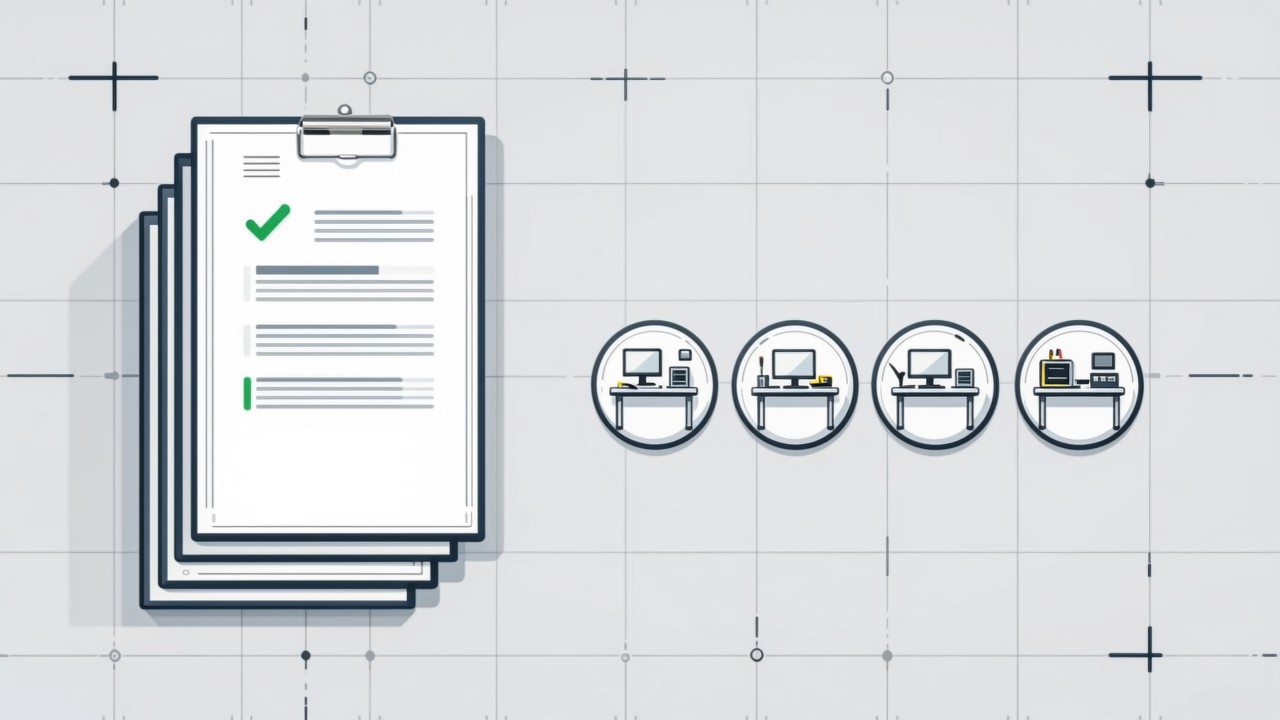
Why SOP Is Not Followed on the Line
SOPs rarely fail because operators ignore them. Five structural reasons explain …
Read more → -
Alarm Fatigue: Why the Floor Turns the System Off
Many visual SOP systems are not beaten by technical problems — they are muted by…
Read more → -
Visual SOP Camera Selection and Mounting
Camera selection for visual SOP is not the same as for product inspection. The s…
Read more →
Need specific advice for your production line?
Our engineers can share practical approaches to process error prevention and SOP compliance inspection for your scenario.
Request a free trial plan