
How to Feed Inspection Data into SPC
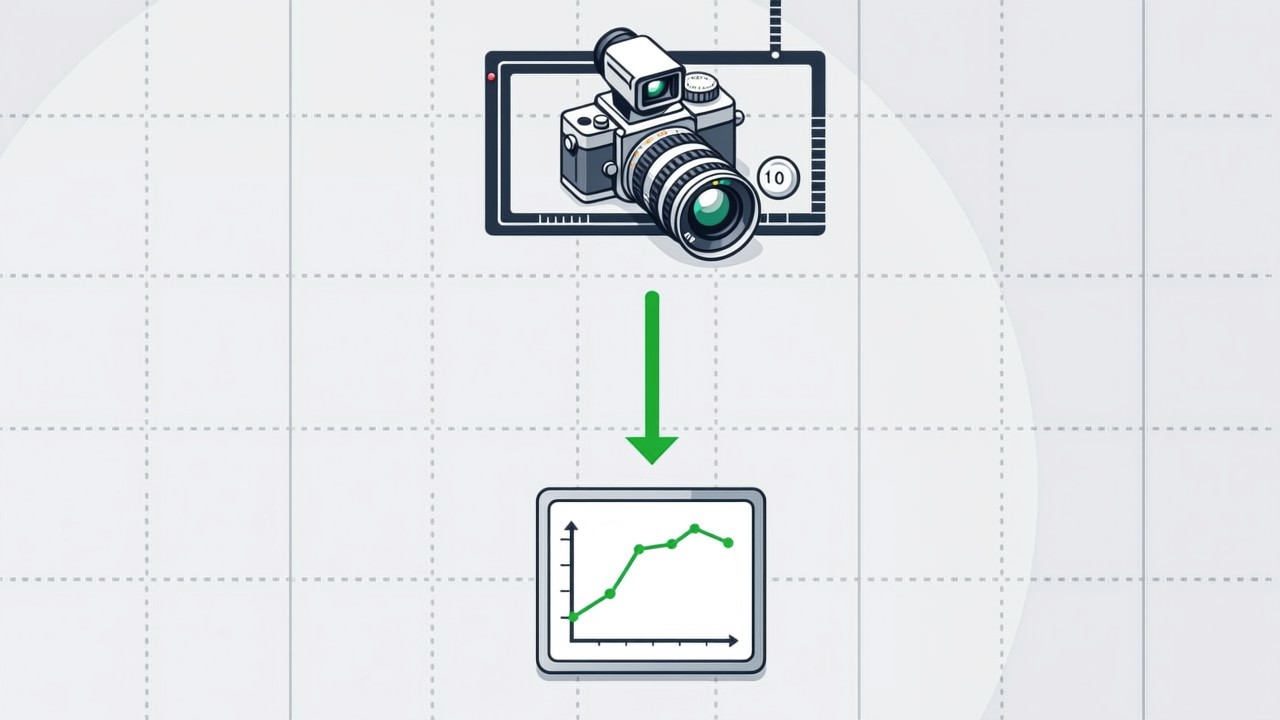
A pass or fail verdict is the end of a decision and the beginning of a datum. The station measured something to reach that verdict — a distance, an angle, a grey-level difference, a position offset — and that measurement is far more useful to the process than the binary outcome, because it moves before the tolerance is reached and therefore gives warning. Most stations discard it. Feeding it into an SPC system is mainly a question of deciding what the number means and keeping the measurement stable enough that the chart reflects the process rather than the camera.
Key takeaways
- Output the measurement, not only the verdict; the value trends before the tolerance is reached.
- Define the characteristic, the units and the part reference before anything is written to the SPC system.
- Measure every part when the cycle time allows; otherwise use a consistent random or fixed-interval scheme.
- Separate measurement variation from process variation first, or the control chart will chart the camera.
A vision station that reports only pass or fail is throwing away the most useful number it produced. To decide that a part passes, the station measured something — a distance, an offset, an angle, a count, a grey-level difference between two regions. That measurement carries information the verdict does not, because it begins to drift long before it crosses the tolerance and therefore gives warning while there is still time to act. The verdict tells you what happened; the value tells you what is happening.
From verdict back to measurement
The first task is to recover the measurement and give it a defensible definition. A station that judges a gap should output the gap in millimetres, with the method written down: which edges were detected, over which span, with which sub-pixel rule. That definition is what makes the number comparable between shifts, between stations and after any software change. A number whose provenance cannot be stated cannot be put on a control chart, because nobody can tell whether a shift in the chart came from the process or from a change in how the number was computed.
The second task is to name it. Each value needs a characteristic to belong to, and that name is the interface to the SPC system: the measurement will be filed under a characteristic identifier, against a part or a batch reference, with a timestamp and the station that produced it. The convention for how those identifiers are formed and how the reference is carried is a design decision in its own right, and it is the same one that governs how values are written back into an upper system, described in writeback field design. Getting it consistent at the start is far cheaper than reconciling two naming schemes after the first month of production data has accumulated.
Every part, or some parts
A vision station can measure every part, which is its principal advantage over sampling inspection. A control chart built on every part is not the same kind of object as a chart built on five parts an hour: with every part measured, the point-to-point variation includes the high-frequency process noise that sampling averages away, and control limits derived from a sampled process will produce constant false signals. This is not an argument against measuring every part. It is an argument for deciding deliberately which population the chart represents and setting the limits accordingly.
| Scheme | Chart reflects | Watch out for |
|---|---|---|
| Every part | The process including high-frequency noise | Limits must be derived from the same population, or signals will be constant |
| Fixed interval (every nth) | The process trend, with noise averaged | A short-lived excursion between samples is invisible |
| Random selection | The process without a systematic bias | Needs the selection to be genuinely random and recorded |
| Batch or shift composite | Trend over hours | Too slow to catch a drift that develops within a shift |
Separate the measurement from the process first
A control chart is only meaningful if the variation it displays comes from the process. A vision measurement carries its own variation: lighting drift, camera noise, calibration drift, edge-detection repeatability on a rough surface. If the measurement variation is a large fraction of the process variation, the chart is mostly displaying the camera, and reacting to it means adjusting a process that was not changing. The standard way to establish the ratio is a gauge study, in which the same parts are imaged repeatedly while the process is held still; the spread of those repeated measurements is the measurement variation, and it can be compared directly against the process spread.
The usual convention is that measurement variation should be a small fraction of the tolerance — a tenth is the classic target, a fifth is often accepted where the process is comfortably capable. This is the same principle that governs the calibration drift limit, since a drifting calibration is one of the contributors to measurement variation, and it is discussed in calibration and drift. Where the ratio cannot be brought down far enough, the honest alternative is to chart the verdict counts rather than the values, or to chart a moving average that suppresses the measurement noise, and to say so in the documentation.
Common questions about inspection data and SPC
Should a station measure several characteristics at once?
It usually does, and each should be treated as a separate characteristic with its own identifier and its own chart. Combining them into a single quality score destroys the diagnostic value: a chart that says the part is slightly worse does not tell anybody which part of the process to look at. Where a composite is genuinely needed for reporting, derive it from the individual values rather than replacing them.
How should a station behave when it cannot measure a characteristic?
That outcome must be represented explicitly rather than as a zero or a pass. A frame where the edge could not be found is not a measurement of zero, and recording it as one will drag a control chart towards a value that never occurred. Give the outcome its own state, exclude it from the control limits, and count it separately so that a rising rate of unmeasurable parts is itself visible.
Does every measured value need to be stored forever?
No, and the distinction is worth making deliberately. Values behind a control chart can often be kept as summaries once they are out of the trending window, while the values behind a traceability claim may have to be kept in full for the retention period. The two requirements have different clocks, and they are discussed in record retention.
Is your station discarding its measurements?
Tell us what your station decides today, and we will work out which values it could be publishing and how to define them so a control chart can use them.
Related articles
-
Alarm Fatigue: Why the Floor Turns the System Off
Many visual SOP systems are not beaten by technical problems — they are muted by…
Read more → -
Visual SOP Camera Selection and Mounting
Camera selection for visual SOP is not the same as for product inspection. The s…
Read more → -
Vision Monitoring at the Semiconductor Die Bonder
Semiconductor packaging stations are characterised by high precision, fast cycle…
Read more → -
Wrong-Assembly Alarms Without the False Alarms
The most common reason a visual SOP project fails is not poor recognition — it i…
Read more →
Need specific advice for your production line?
Our engineers can share practical approaches to process error prevention and SOP compliance inspection for your scenario.
Request a free trial plan